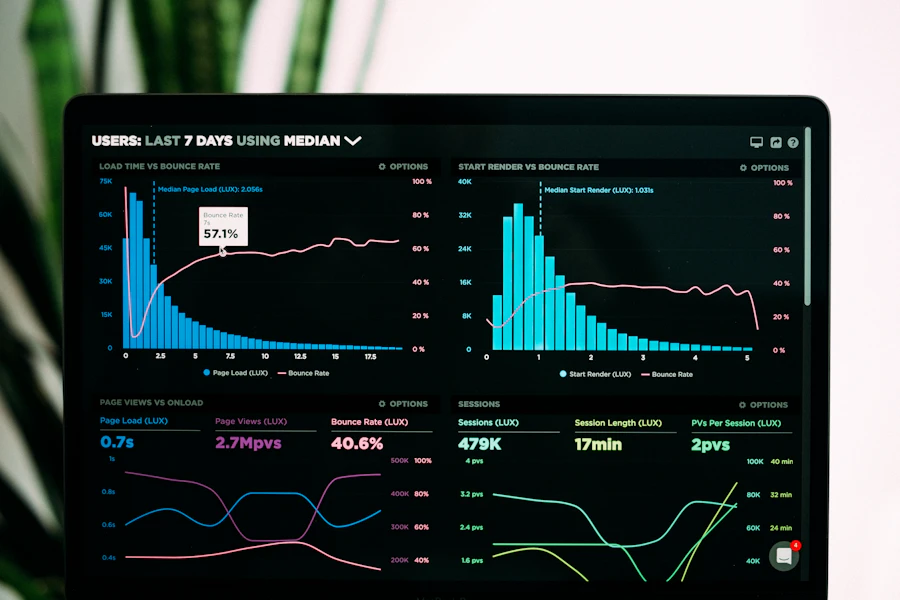
Techhold Developers builds advanced Logistics Analytics Dashboards that give fleet, freight, and supply chain operators real-time visibility, KPI tracking, and predictive insight β all in one command center.
Every dashboard we build is tailored to your fleet, routes, and business model β but here's a preview of the metrics and layout our clients use daily.
Without a unified analytics layer, logistics operators lose money silently β in idle vehicles, inefficient routes, missed SLAs, and unpredictable fuel costs.
Managers rely on end-of-day reports and phone calls instead of live data.
Idling, harsh driving, and inefficient routes silently consume margin.
Late deliveries damage customer trust and trigger penalty clauses.
Vehicles sit idle while others are overbooked β with no visibility to rebalance.
Problems are discovered after they've already cost money.
Telematics, ERP, TMS, and fuel cards all live in different systems.
Every Techhold logistics dashboard is modular. We deploy the components that matter most to your operation and integrate them with your existing systems.
Live GPS, vehicle status, and geofencing on a unified map view.
Fuel consumption, cost per km, and anomaly detection.
On-time rates, SLA compliance, and route-level breakdowns.
Service schedules, downtime tracking, and predictive alerts.
Safety scores, harsh driving events, and productivity metrics.
Board-ready KPIs, trends, and financial summaries.
AI-driven forecasts for demand, fuel, and maintenance.
Real-time notifications for delays, exceptions, and thresholds.
Connect telematics, ERP, TMS, and fuel card platforms.
We focus every dashboard on the KPIs that actually drive profitability and customer retention.
Track and reduce the largest variable cost in your fleet.
Monitor SLA compliance per route, driver, and customer.
Identify idle vehicles and rebalance load across the fleet.
Reduce downtime with predictive maintenance scheduling.
See exactly what each drop costs β and where to optimize.
Harsh braking, speeding, and idling events per driver.
Reduce failed deliveries and reattempt costs.
Understand profitability at the asset level.
We design your dashboard as a control tower β a single pane of glass where dispatchers, operations managers, and leadership can all see the same live picture of the business.
We layer machine learning on top of your operational data to anticipate issues before they happen β from fuel fraud to maintenance failures to demand surges.
We don't replace your systems β we unify them. Your dashboard pulls data from the platforms you already use.
GPS & vehicle data
SAP, Oracle, Odoo
Transport management
Transaction feeds
POD & check-in data
Power BI, Looker
Average improvements within 6 months of deploying a Techhold logistics analytics dashboard.
We deliver logistics analytics dashboards across industries where fleet performance, delivery SLAs, and cost control matter most.
Long-haul and cross-border trucking operations.
Courier and parcel delivery businesses.
Inbound and outbound logistics for plants.
Multi-store and wholesale distribution fleets.
Tipper, mixer, and heavy equipment fleets.
Fuel distribution and tanker operations.
Medical supplies and cold chain delivery.
Farm-to-market and cold chain operations.
How we helped a Nairobi freight operator cut fuel costs and improve delivery performance.
Challenge: A 120-vehicle freight operator had no
real-time visibility across routes, drivers, and fuel usage.
Fuel costs were rising, SLAs were slipping, and leadership
lacked reliable reporting.
Solution: A custom Logistics Analytics Dashboard
integrating telematics, fuel card, and TMS data β with predictive
maintenance and driver scoring built in.
A structured, engineering-led process that gets you from kickoff to live dashboards in weeks β not quarters.
Operational review, KPI definition, and data source mapping.
Dashboard UX, data model, and integration architecture.
Develop, integrate, and validate with live operational data.
Rollout, training, and ongoing optimization and support.
Trusted by fleet, freight, and distribution operators across East Africa.
"The dashboard Techhold built changed how we run our fleet. We now catch fuel anomalies the same day, and our dispatch team operates with complete visibility. The ROI was clear within the first quarter."
"We'd tried BI tools before, but never had a system built specifically for logistics. Techhold understood our operations and delivered a dashboard that our whole team actually uses."
Flexible packages based on fleet size, data complexity, and integration requirements. All include ongoing support.
Answers to common questions about our logistics analytics dashboards.
Most Starter engagements go live in 4β6 weeks. Growth packages typically take 8β10 weeks. Enterprise deployments are scoped individually based on complexity and integrations.
We integrate with all major telematics providers used in Kenya and East Africa, including those offering GPS, fuel sensors, and driver behavior data. If your provider offers an API, we can connect to it.
Yes. For 3PL and freight operators who want to share delivery performance with clients, we can provide white-labeled customer portals with your branding.
Both options are available. We can host on our secure cloud infrastructure, or deploy into your own environment (AWS, Azure, GCP) if you prefer full data control.
All data is encrypted in transit and at rest. We follow ISO 27001-aligned practices, implement role-based access control, and can sign NDAs and data processing agreements as required.
We provide team training, documentation, and ongoing support. Most clients continue with a monthly support and enhancement retainer to add features and refine KPIs over time.
Yes. Many clients start with a mix of automated and manual data. We build ingestion pipelines that combine telematics feeds, fuel cards, ERP exports, and spreadsheet inputs into a single unified dataset.
Tell us about your fleet and operational challenges. We'll respond within one business day with next steps.