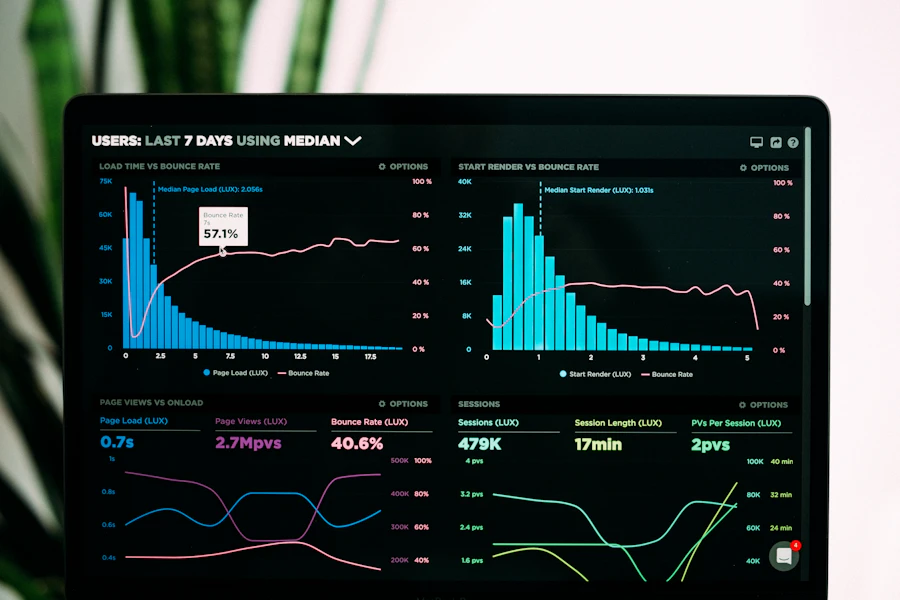
Stop Guessing. Start Measuring What Matters.

Traffic is vanity. Revenue is sanity. Techhold Developers sets up Google Analytics 4, conversion tracking, and executive SEO reporting that connects every marketing shilling to real business outcomes.

📊
180+ GA4 Properties Set Up
🎯
2,400+ Conversions Tracked Monthly
📈
Monthly Executive Dashboards
✓
GA4 Verified
Analytics Overview
Last 28 days · Nairobi Region
LIVE
128K
SESSIONS
4.8K
CONVERSIONS
3.7%
CONV. RATE
Organic Search 58,241
Direct 32,108
Paid Search 18,905
📈
+215% Conversions

Why Bad Analytics Costs You Revenue

Most Nairobi businesses have Google Analytics installed — but they're not actually measuring what drives revenue. Here's what broken analytics really costs.

📉

Incomplete Data

GA4 misconfiguration means half your traffic, conversions, and revenue never gets tracked.

🎯

No Conversion Tracking

Without proper goal and event setup, you can't tell which channels actually produce customers.

🧩

Fragmented Reporting

GSC in one tab, GA4 in another, Ads in a third — no single source of truth for leadership.

📊

Vanity Metrics

Dashboards full of sessions and page views — but no clarity on revenue or ROI.

💸

Wasted Ad Spend

Without attribution, you keep funding underperforming channels and starving winning ones.

🔒

No Executive Visibility

Leaders can't make marketing investment decisions because data isn't decision-ready.

Our Analytics & SEO Reporting Services

Complete measurement infrastructure — from GA4 setup and conversion tracking to executive dashboards and monthly SEO reporting for Nairobi businesses.

📊

Google Analytics 4 Setup

Complete GA4 property configuration, data streams, and event tracking.

🎯

Conversion & Goal Tracking

Goals, events, eCommerce tracking, and lead form conversions configured correctly.

🔍

Google Search Console Integration

GSC-GA4 linkage for unified search and behaviour data.

📈

SEO Performance Reporting

Rankings, traffic, leads, and revenue reporting tied to SEO campaigns.

📋

Looker Studio Dashboards

Custom executive dashboards fed by GA4, GSC, Ads, and CRM data.

🔗

Attribution & Channel Analysis

Multi-channel attribution modelling to identify true revenue drivers.

⚙️

Tag Manager Implementation

Google Tag Manager setup, server-side tagging, and tag governance.

🛒

eCommerce Analytics

Enhanced eCommerce, product performance, and revenue attribution.

📱

Mobile App Analytics

Firebase and GA4 for Apps tracking for Kenyan mobile-first audiences.

🎓

Analytics Training

Team training on GA4, Looker Studio, and data-driven decision making.

📅

Monthly Reporting Retainers

Ongoing analytics monitoring, insights, and executive reporting.

🔎

Audience & Behaviour Analysis

Deep audience segmentation, funnels, and user journey analysis.

Our Analytics & Reporting Process

A structured, data-first process that transforms fragmented metrics into clear, actionable business intelligence.

01 — AUDIT

Measurement Audit

Review of current tracking, gaps, data quality, and business goals.

02 — BUILD

Implementation

GA4, GTM, conversion tracking, CRM integration, and data layer build.

03 — VISUALISE

Dashboard Build

Custom Looker Studio dashboards for executives and marketing teams.

04 — OPTIMISE

Insight & Optimisation

Monthly analysis, insights, and recommendations tied to revenue.

Get GA4 Right the First Time

GA4 is fundamentally different from Universal Analytics. Without correct configuration, you'll miss critical events, conversions, and audience data — and lose historical context.

  • Property & data stream configuration
  • Enhanced measurement & custom events
  • Conversion events & key event setup
  • Audience & remarketing audience building
  • GA4 + Google Ads + GSC linkage
  • BigQuery export for advanced analysis

Google Analytics 4 setup for Nairobi business

Measure Every Lead and Sale

If you can't track it, you can't optimise it. We build conversion tracking that captures every meaningful action on your site — and connects it to revenue.

  • Lead form and contact tracking
  • Phone call and WhatsApp click tracking
  • eCommerce purchase & checkout tracking
  • Scroll, engagement, and micro-conversions
  • CRM integration and offline conversion imports
  • Attribution modelling and channel comparisons
Conversion tracking dashboard for Nairobi digital marketing

Reporting That Ties SEO to Revenue

We don't report rankings in isolation. Every report connects SEO activity to traffic, leads, pipeline, and revenue — so leadership can see clear ROI.

  • Rankings and share of voice tracking
  • Organic traffic and landing page analysis
  • Keyword-level conversion reporting
  • Organic revenue and pipeline attribution
  • Monthly executive summaries
  • Quarterly strategy reviews with insights
SEO reporting and analytics review for Nairobi business

Executive Dashboards Built for Decisions

Custom, branded Looker Studio dashboards that unify your marketing data into one clear, always-live view — designed for CEOs, CMOs, and marketing managers.

  • GA4, GSC, Google Ads, Meta Ads connectors
  • CRM and revenue data integration
  • Executive and operational views
  • Automated refresh & alert thresholds
  • White-label branding for agencies
  • Mobile-friendly dashboard design
Looker Studio executive dashboard for Nairobi business

The Reports We Build and Manage

We design, build, and manage every report you need to run a data-driven marketing operation in Nairobi, Kenya, and beyond.

📊

Executive Summary Dashboard

Board-ready KPIs across all channels and revenue sources.

🎯

Conversion Report

Leads, sales, and micro-conversions by source and campaign.

🔍

SEO Performance Report

Rankings, traffic, conversions, and organic revenue growth.

📈

Channel Attribution Report

Compare channels by cost, revenue, and ROI.

🛒

eCommerce Performance

Product, category, and checkout funnel reporting.

📱

Device & Geo Report

Nairobi vs regional and device-level performance.

🧩

Campaign Performance

Paid and organic campaign performance unified.

👥

Audience & Behaviour

Segments, funnels, and user journey analysis.

KPIs We Track For You

Every KPI in your dashboard ties directly to a business outcome your leadership team cares about — not vanity metrics.

💰

Revenue

Total revenue attributed to each channel and campaign.

🎯

Qualified Leads

Leads that meet your sales qualification criteria.

📊

Cost Per Acquisition

Blended CPA by channel and campaign.

📈

Return on Ad Spend

ROAS across paid channels and campaigns.

🔍

Organic Visibility

Share of voice across priority keyword clusters.

🛒

Conversion Rate

Site-wide and page-level conversion rates.

🔄

Customer Lifetime Value

LTV by acquisition channel and cohort.

🏆

Marketing Efficiency

Revenue per marketing shilling spent.

Analytics & Reporting Deliverables

Every engagement produces documented, actionable outputs — not just screenshots.

✓

GA4 Property Configuration

Correctly configured events, conversions, and audiences.

✓

Google Tag Manager Setup

Clean, governed tag implementation with data layer.

✓

Conversion Tracking Map

Documented conversion points and tracking approach.

✓

Custom Looker Studio Dashboard

Executive and operational views, live and branded.

✓

SEO Reporting Template

Monthly report template for leadership and stakeholders.

✓

Attribution Model Documentation

How channels and campaigns are being credited.

✓

Monthly Insights Report

Data-driven insights with clear next actions.

✓

Quarterly Business Review

Quarterly review connecting analytics to strategy.

✓

Team Training Session

Hands-on training on GA4 and Looker Studio.

Analytics & Reporting Case Study

How a full analytics rebuild transformed a Nairobi business's marketing decision making.

Analytics case study for Nairobi business

Nairobi eCommerce & Retail

Problem: Broken Universal Analytics, no conversion tracking on the new GA4, and marketing decisions based on raw traffic — not revenue.

Solution: Complete GA4 and GTM rebuild, eCommerce conversion tracking, CRM integration, executive Looker Studio dashboard, and monthly insights reporting.

+312%
Tracked Conversions
+187%
Revenue Attribution
-42%
Wasted Ad Spend
5
Months to Results

What Our Clients Say

Real outcomes from Techhold Developers' analytics & reporting services.

★★★★★

"Before Techhold, we couldn't tell which campaigns actually produced revenue. Now our executive dashboard shows everything in real time. We've cut 42% of wasted ad spend."

Faith Njeri, CMO at Nairobi Retail Group
Faith Njeri
CMO, Nairobi Retail Group
★★★★★

"Techhold Developers rebuilt our GA4 setup, wired everything into Looker Studio, and now our weekly meetings run on data. Best analytics investment we've made."

Kevin Mutua, Founder at Nairobi SaaS Company
Kevin Mutua
Founder, Nairobi SaaS Company

Analytics & Reporting FAQs

Answers to the questions we hear most from Nairobi businesses.

How much do Google Analytics & SEO reporting services cost in Nairobi?
GA4 setup and tracking implementation in Nairobi typically ranges from KES 60,000 to KES 200,000 depending on complexity. Monthly SEO reporting and analytics retainers start from KES 40,000. Custom Looker Studio dashboard builds are quoted per scope after a free discovery call.
Why do I need GA4 setup and SEO reporting as a Kenyan business?
GA4 and SEO reporting give you visibility into what's actually driving revenue — not just traffic. Without correct GA4 setup, conversion tracking, and unified SEO reporting, you're flying blind and wasting budget on ineffective channels. Techhold Developers makes every shilling accountable.
Do you build custom Looker Studio dashboards?
Yes. Techhold Developers builds custom Looker Studio dashboards connected to GA4, Google Search Console, Google Ads, Meta Ads, and CRM data. Dashboards are designed for executive visibility and refresh automatically.
What's the difference between GA4 and Universal Analytics?
GA4 is Google's event-based analytics platform — a fundamental shift from Universal Analytics' session-based model. GA4 supports cross-platform tracking (web + app), privacy-first measurement, and predictive metrics. Universal Analytics stopped processing new data in July 2023.
Can you migrate historical Universal Analytics data?
Historical UA data cannot be migrated into GA4, but we can export it (via BigQuery or CSV) and display it alongside GA4 in Looker Studio, so you retain continuity for year-over-year comparisons.
Do you provide ongoing analytics and reporting support?
Yes. We offer monthly analytics retainers that include monitoring, insight reports, quarterly business reviews, and dashboard maintenance. Critical alerting is included for conversion and revenue anomalies.
Do you work with businesses outside Nairobi?
Yes. We deliver analytics and reporting services to businesses across Kenya — including Mombasa, Kisumu, Nakuru, Eldoret, and Thika — and internationally. All work is delivered remotely with shared dashboards.

Get Your Free Analytics & Reporting Audit

We'll review your GA4 setup, conversion tracking, and current reporting — then deliver a prioritised action plan to make every marketing shilling accountable.

Request Free Audit →
GA4 configuration review
Conversion tracking check
GTM tag audit
Reporting gaps analysis
Attribution review
Looker Studio demo
KPI framework preview
30-min strategy call

Analytics & Reporting Services in Your City

Techhold Developers serves businesses throughout Kenya — remote-first, data-obsessed.

Ready to Make Every Shilling Accountable?

Stop guessing where your marketing money goes. Let's build measurement infrastructure that turns data into decisions — and decisions into revenue.

Get Started Today →